Statistics
In the last years I have created many statistics and visualization for
steem and hive.
I developed them with different programming languages and usesd only for myself.
Now I'm gradually converting them to js, so everyone can use it here.
First thing I'm working on are the votecharts, that you can test in an early beta version.
Here are some examples, where I already post someting from my tool in the past.
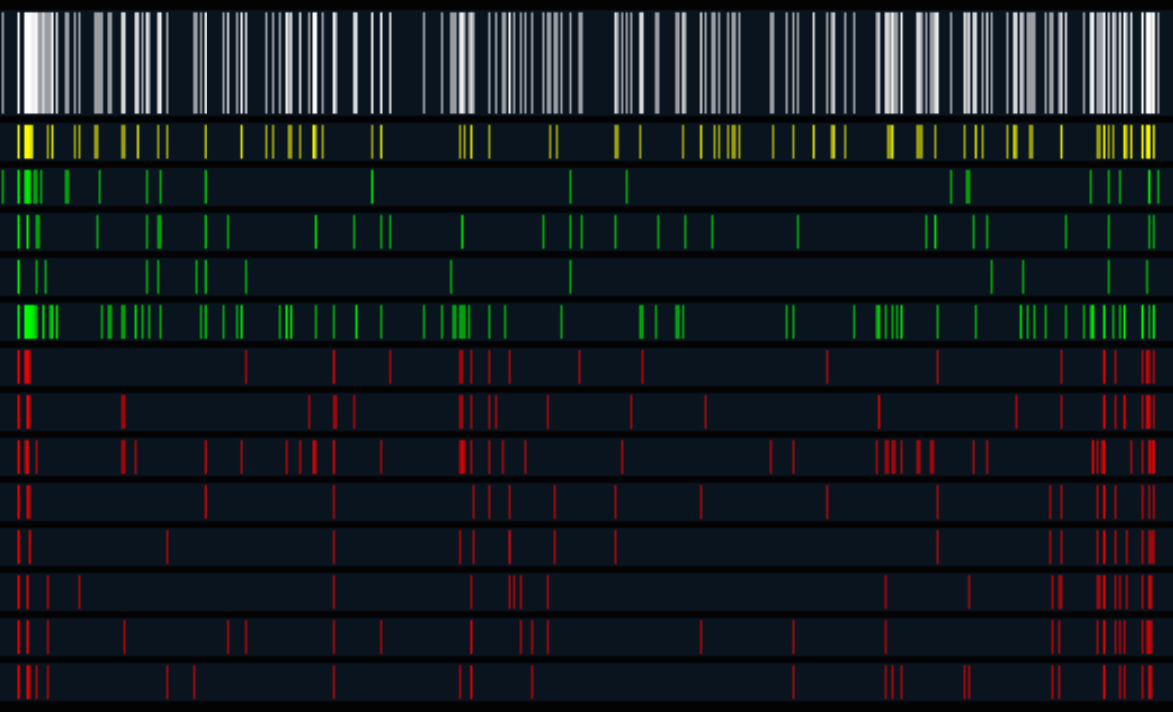 image from:
  image from:
  image from:
  image from:
  image from:
  image from: